This work is a collaboration between World Expo Dubai 2020 and Gapminder, as part of the project called Flip Your Worldview. It is our first attempt to create a Gapminder Index to show how wrong people are about the progress of different countries by measuring the gap between perception and data. The results are based on roughly sixty thousand responses from the public in three countries: the UK, Japan and Brazil. We asked three different fact questions about the progress of each of the 197 countries in the world. We then calculated the gap between the average response and the official data for each country. The pattern of misconceptions is very clear:
Most people are roughly correct about the progress of “THE WEST”,
but they severely underestimate the progress of “THE REST”.
The progress of 7 billion people is underestimated by 52%, on average!
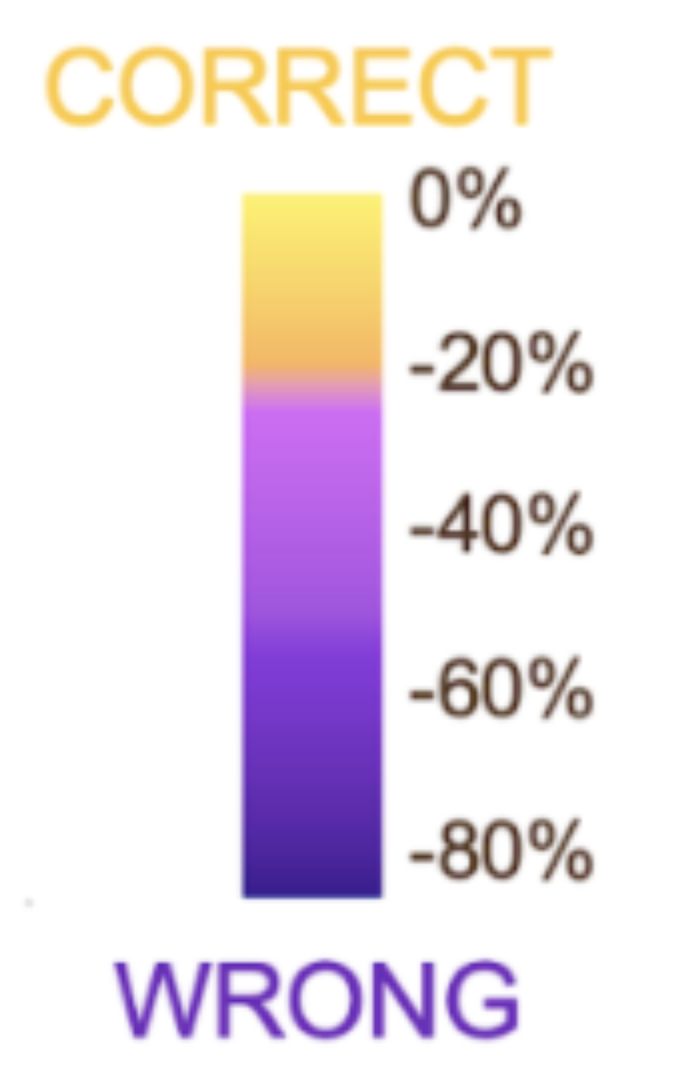
Yellow means least misunderstood, and dark purple means most misunderstood.
These two graphs show the actual progress and the perceived progress of all countries. The word progress here means the average percent of : 1. % electricity coverage; 2. % babies getting some vaccine; and 3. % children enrolled in primary school. The size of the bubbles show population size. (More options here)
A harmful global stereotype
If you come from a non-western country, you are probably tired of hearing stereotypes about your country. But what if those stereotypes are not actually about your country? What if exactly the same stereotypes exist for 90% of humanity… Maybe that’s why it feels like a waste of time to confront them one country at a time. We hope this index can help people realize that it’s the whole worldview that needs to be flipped. The underestimation of progress is a GLOBAL stereotype.
Gapminder is developing this index because we believe stereotypes hurt global collaboration. To underestimate others’ progress is also to underestimate their ability. Today, the world is more globalized than ever before and we need lots of global collaboration, which we believe is hindered by common misconceptions.
Our common failure to stop COVID-19 is just one example where this global stereotype is hindering collaboration. As long as people believe that most countries fail to vaccinate their babies, they won’t support investment to produce COVID-19 vaccines for everyone, because they will think countries cannot administer such a massive vaccination project. They will assume there’s not enough infrastructure to get the jabs to the people. They are wrong. If they knew that 85% of newborn babies worldwide received at least one vaccination in 2020, they would realize that a majority of people live within reach of a modern vaccination infrastructure: roads, electricity and educated nurses who can administer COVID-19 shots. Instead, most people suffer from the misconception that only a minority of humanity is within reach of modern medicine. That was true 50 years ago. To collaborate better, we need to upgrade the common worldview.
The COVID-19 pandemic is just one example of a global risk that could have been prevented or better managed with better collaboration. There are at least three other such global risks that also have the potential to stop most progress locally, if they are not prevented globally: The risk of financial collapse, the risk of a third world war, and the risk of global warming. All those risks require massive global collaboration to be prevented. All such collaboration will be much easier if we flip our worldview, and stop underestimating the majority.
Methodology
About the study
During 2021, we conducted hundreds of online surveys asking thousands of people in Japan, the UK and Brazil about their perceptions of progress of all 197 countries. In total, we asked around 600 questions in each country, using Google Surveys. The results are based on answers from 7,875 online respondents: roughly 35 per country for each question. The majority of the surveys were run in August 2021. Some of the surveys in the UK were conducted already in 2020. This is not an academic study. It hasn’t been peer reviewed and is not intended for any academic journal. If some academic researcher wants to build on our work, they are most welcome. We published these findings freely on our website, on 14 January 2022, because we think the world needs to know this.
The three components of this index
In this pilot version of the Gapminder Index, we tested people’s perception of progress in terms of: electricity, basic schooling and child vaccination. These are the three components of the index. Here are the templates for the three questions we asked for each country:
- How many babies in [country] were vaccinated against some disease in [year]?
- In [country], of all children aged 7-11, how many went to school in [year]?
- How many people in [country] have some access to electricity?
Here’s a concrete example, we asked these three questions about Peru:
1. How many babies in Peru were vaccinated against some disease in 2019?
- Around 10%
- Around 25%
- Around 40%
- Around 50%
- Around 60%
- Around 75%
- Around 90%
(CORRECT ANSWER: g. 90% )
2. In Peru, of all children aged 7-11, how many went to school in 2018?
- Less than 5%
- Around 15%
- Around 30%
- Around 50%
- Around 70%
- Around 85%
- More than 95%
(CORRECT ANSWER: g. 99% )
3. How many people in Peru have some access to electricity?
- Less than 10%
- Around 20%
- Around 35%
- Around 50%
- Around 65%
- Around 80%
- More than 90%
(CORRECT ANSWER: g. 95%)
In many countries during the COVID-19 pandemic, school enrollment and vaccination of babies declined a lot during 2020. To make sure the respondents don’t think we are asking about the present situation, we included the year in the question.
Data sources
The data for the correct answers came from three different sources:
- Percentage of babies with some vaccination, is based on data from the WHO and UNICEF. To avoid asking about a specific child vaccine, we have taken those numbers and calculated the share of one-year-olds who have received at least one of the following vaccinations: BCG, DTP3, HepB3, HIB3, Measles 1st, Measles 2nd, PCV3, Pol3 or RotaC. We use the data for the vaccine with the highest coverage. You can see a graph with this data here and find more documentation here.
- Primary school data comes from UNESCO using an indicator called “Adjusted net enrollment rate, primary (% of primary school age children)”. The year of the latest reported data varies across countries and therefore we explicitly include the year in the question. You can explore the latest data in our bubble tool here.
- Electrification data comes from The Energy Progress Report (which is a collaboration between the World Bank, International Energy Agency,WHO, UN and International Renewable Energy Agency). In the question we ask about “some access to electricity” to compensate for the fact that billions of people who registered as “having access”, still experience many outages each week.
Calculating the Gapminder Index
This pilot version of the Gapminder Index is calculated in four steps.
Step 1. Calculate Perceived Progress for each component
We calculated a weighted average of the responses from all three countries. The questions were asked with seven options, and first we converted the open-ended options, like “Less than 5%” and “More than 95%”, to exact numbers, like “3%” and “98%”. Then we calculated the weighted average of the responses into a single number of the average perception. In the case of Senegal, the responses looked like this:
| Text options | Fewer than 5% | Around 15% | Around 30% | Around 50% | Around 70% | Around 85% | More than 95% |
| Numeric version of options | 2% | 15% | 30% | 50% | 70% | 85% | 97% |
| Survey responses | 67% | 9% | 25% | 0% | 0% | 0% | 0% |
When we calculated the weighted average of the responses using the numeric version of the answer options, we found that across the three countries people on average believed that 10% of babies had received a vaccine in Senegal. That is what we call Perceived Progress. Next we will compare that with the official data.
Step 2. Calculate Perception Gap for each component
The perception gaps for all three indicators are calculated by taking the difference between the Perceived Progress and the Actual Progress from the data source. When it comes to child vaccination in Senegal, the perception is 10% and the actual number is 96%, which means the Child Vaccination Perception Gap for Senegal is -86%, as illustrated here: 10-96=-86 . This is a negative number to express that the Perception is below the Actual progress.

Step 3. Calculate Misconception Ratios for each component
The Misconception Ratio expresses the Perception Gap as a share of the Actual Progress. For each component we take the Perception Gap and divide by the Actual Progress. For the example of Vaccination in Senegal, we get this Misconception Ratio: -86/96 = 89.6%.
It may seem unnecessary to take two percentages and calculate a third percentage from them, but the reason we do this is to normalize the scale of misconceptions independent of the level of progress of a country. For example, if a country has an Actual Progress of 80%, and the Perceived Progress is 40%, that means the Perception Gap is negative -40% and the Misconception Ratio is half: -40 /80 = -1/2. Another country that has made much less progress, may have a Actual Progress of 30%, but people think it has only reached 15%, then that also has a Misconception Ratio of -0.5: -15 / 30 = -1/2. In both these cases one can say that the progress is underestimated by half, which is what the ratio expresses.
If the Perception Gap is a positive number, which rarely happens because people rarely overestimate progress, then we calculate the ratio in a slightly different way. We then divide the Perception Gap with the Perceived Progress, instead of the Actual progress. This means that a country where the Actual Progress is 60%, but the Perceived Progress is 80%, gets a Perception Gap of positive 20%, and a Misconceptions Ratio of 20/80 = 1/4, which expresses that people think the progress is 25% higher than it actually is.
Step 4. Calculate the Gapminder Index Score
In this pilot, the Gapminder Index Score is the average of the Three Misconception Ratios. In this pilot version we always have a negative number, because all countries are on average underestimated, but in future versions we may very well end up with overestimations.
Here’s an example of the calculation of Senegal’s Score.
| Vaccination | Schooling | Electricity | |
| Perceived Progress | 10% | 20% | 26% |
| Actual Progress | 96% | 76% | 67% |
| Perception Gap | -89% | -56% | -41 |
| Ratio calculation | -89/96 | -56/76 | -41/67 |
| Misconception Ratio | -90% | -74% | -61% |
| Index Calculation: Average(-90%, -74%, -61%) | |||
| Gapminder Index Score for Senegal: -75% |
Caveats
Survey uncertainty
The study was conducted with Google Surveys, because it was the most affordable service we could find to gather 60,000 answers.
The samples in these surveys were too small for most kinds of analysis. But we still decided to publish the results because the overall pattern is so clear. All “western” countries (except Portugal) were better understood than the entire rest of the world. We are convinced these results cannot be a random coincidence caused by too small samples, but the exact results for each country should still be considered highly uncertain. For example, the exceptional underestimation of Portugal is not certain at all. If we ask the same questions again to larger and more representative samples it’s very likely that Portugal’s progress will end up being perceived just like the other western countries.
In most of the surveys, we actually asked nearly three times as many respondents compared to what we ended up using. Many respondents in Google Surveys are randomly clicking different options to quickly get to the end of the survey. We realized this by including simple control questions which these non-serious users failed to answer. We realized that roughly 70% of the responses to our questions with seven options are just noise. Therefore we developed a quick method to remove noise from all surveys, as described here.
Data Source Uncertainty
All statistics have some uncertainty, and one could argue that it’s misleading to call the official statistic number a “correct answer”. Therefore none of the numbers in this pilot study should be considered exact. It’s only the big pattern that is clear. If we for example assume that an official number of 88% electricity coverage is exaggerating reality by 10%, then the real number would be closer to 78%. We still dare to use this data, because in all countries where data may be very bad, the misconceptions are even worse. People would guess the coverage is maybe 23%, which is still much much lower than reality. We are convinced that the size of the misconception is much larger than the uncertainty of the data.
Future of the project
We call this a pilot study, because we see many ways to improve the methodology. We want to increase the sample sizes and run surveys in more countries, and ask about the progress of more indicators. In this pilot phase of the project, The Gapminder Index uses three questions and is asked in just 3 countries. In the future we hope to scale the scope, adding more questions to the Gapminder Index itself, preferably asking about the progress across all the Sustainable Development Goals. We would also like to ask more respondents in more countries. Ideally, it should be asked regularly, and thereby enable us to measure how stereotypes of countries change over time. We hope we can find funding to do all of that.