Documentation — version 12
Download » Excel file with data for countries, regions and global total — v12
Summary documentation of v12
Sources
— 1800 to 1950 (and in some cases also years after 1950): Gapminder v6 which were compiled and documented by Mattias Lindgren, see previous versions further down on this page.
— 1950 to 2014: In most cases we use the latest UN estimates from World Population Prospects 2017 published in the file with Annually interpolated demographic indicators, called WPP2017_INT_F01_ANNUAL_DEMOGRAPHIC_INDICATORS.xlsx , accessed on September 2, 2017.
— 2015 – 2099: We use the UN forecast of future fertility rate in all countries, called median fertility variant.
How the sources were combined
In general we link our historic estimates with the UN data by smoothly transitioning the curves over a period of 30 years form whatever our historic sources had to the levels that UN is publishing. This means that in the period 1930 to 1970 we move between the two sources, which often has minor differences, like in the case of Senegal here, where the dashed line move form our historic (red line) to the new UN data (blue line).

In some cases, the difference in this period is very large. The most drastic example is Gabon, where UN publishes a very low estimate for 1950 (the blue line9 whereas our historic sources tells us the number of children per woman was probably much higher. In this extreme example, you can see how our final dashed line, is diverging from our historic sources (red lin) in the 1930’s and getting closer to the UN blue line year by year to finally connect with it in 1980. 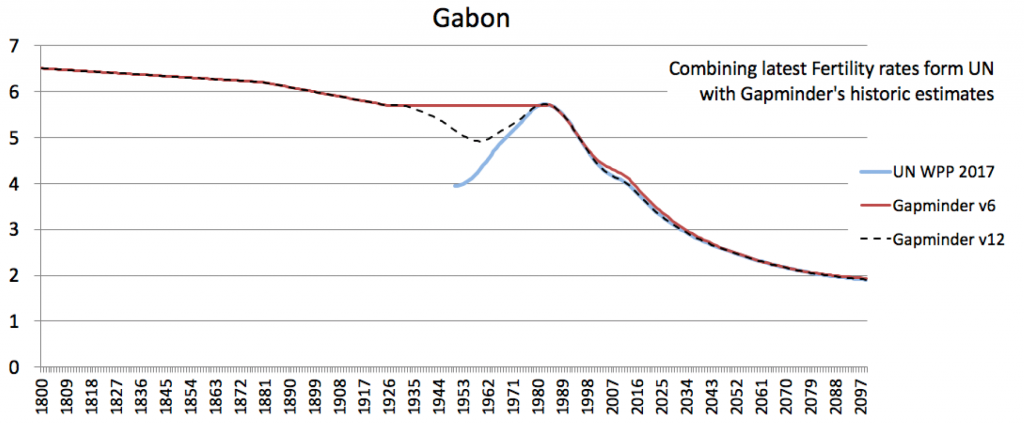
But in many cases the UN data is not used, between 1950 and 2014, because it is smoothed. Interesting dips and spikes are not showing up like in the examples of Australia and China. The blue line represents the UN official data and the red line comes from historic records documented in version 6 below.

In some cases the UN has been smoothed, like in this example for Australia. In those cases we use data form the national bureau of statistics instead as documented in Gapminder v6 below.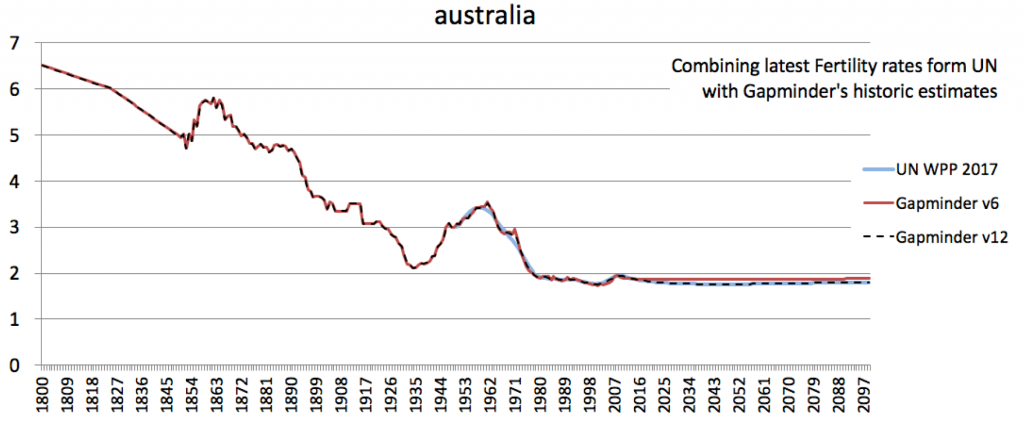
Global and regional averages
To global total fertility rate was calculated as an average of all countries weighted by their population sizes. The proper way to calculate it would be to account for the number of women in fertile ages and their birth patterns, but this method comes very close to the official UN world fertility rate with a much simpler method. IN 1950, the UN number for global fertility rate is 5.0 and the average of all countries weighted by population is 4.84. In 2017, the comparison gives us, UN: 2.48 vs. 2.46. The regional numbers are also calculated as averages weighted by population size.
Detailed documentation and feedback
For transparency we provide the files we used to calculate this data here, but we haven’t had time to clean them up and document all the steps in the process, see our data method overview. Any questions about the data and suggestions for how to improve it are always very welcome: in our data forum.
Previous versions
Version 6
Download documentation (pdf)
» Download excel-sheet with data & meta-data (xlsx)
Version 5
» Download excel-sheet with data & meta-data (xlsx)
Version 4
» Download excel-sheet with data & meta-data (xlsx)
Version 1
» Go to the google-spreadsheet that contains a copy of the “data quality rates” for version 1
» Download documentation of version 1 (pdf)